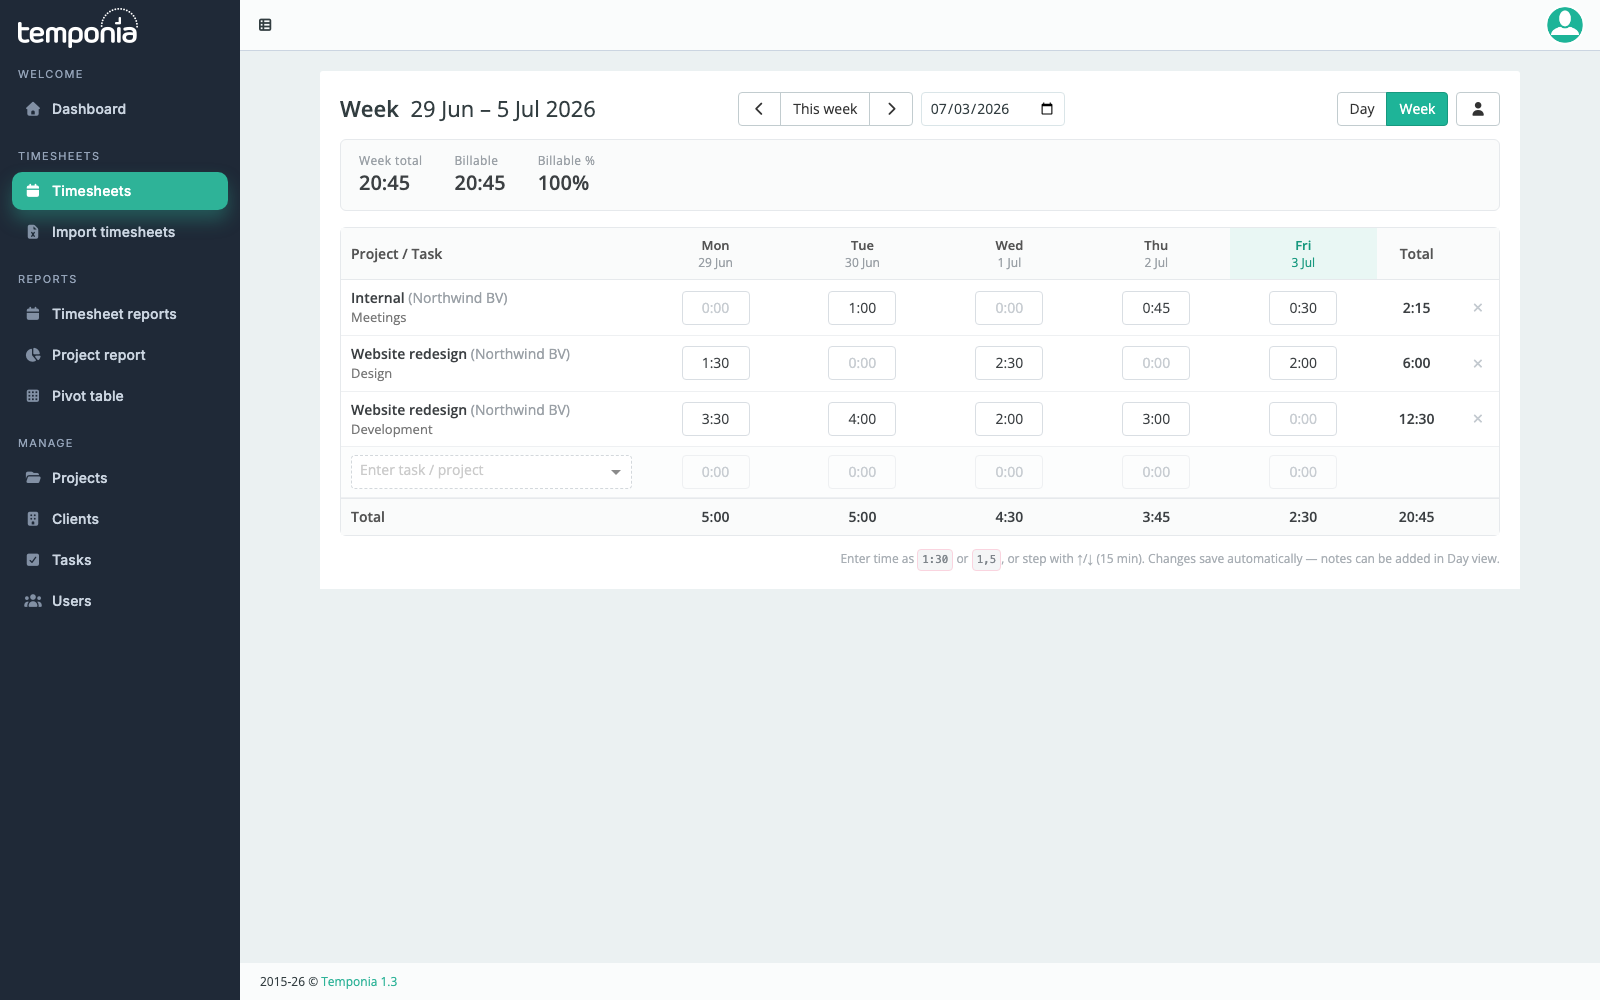
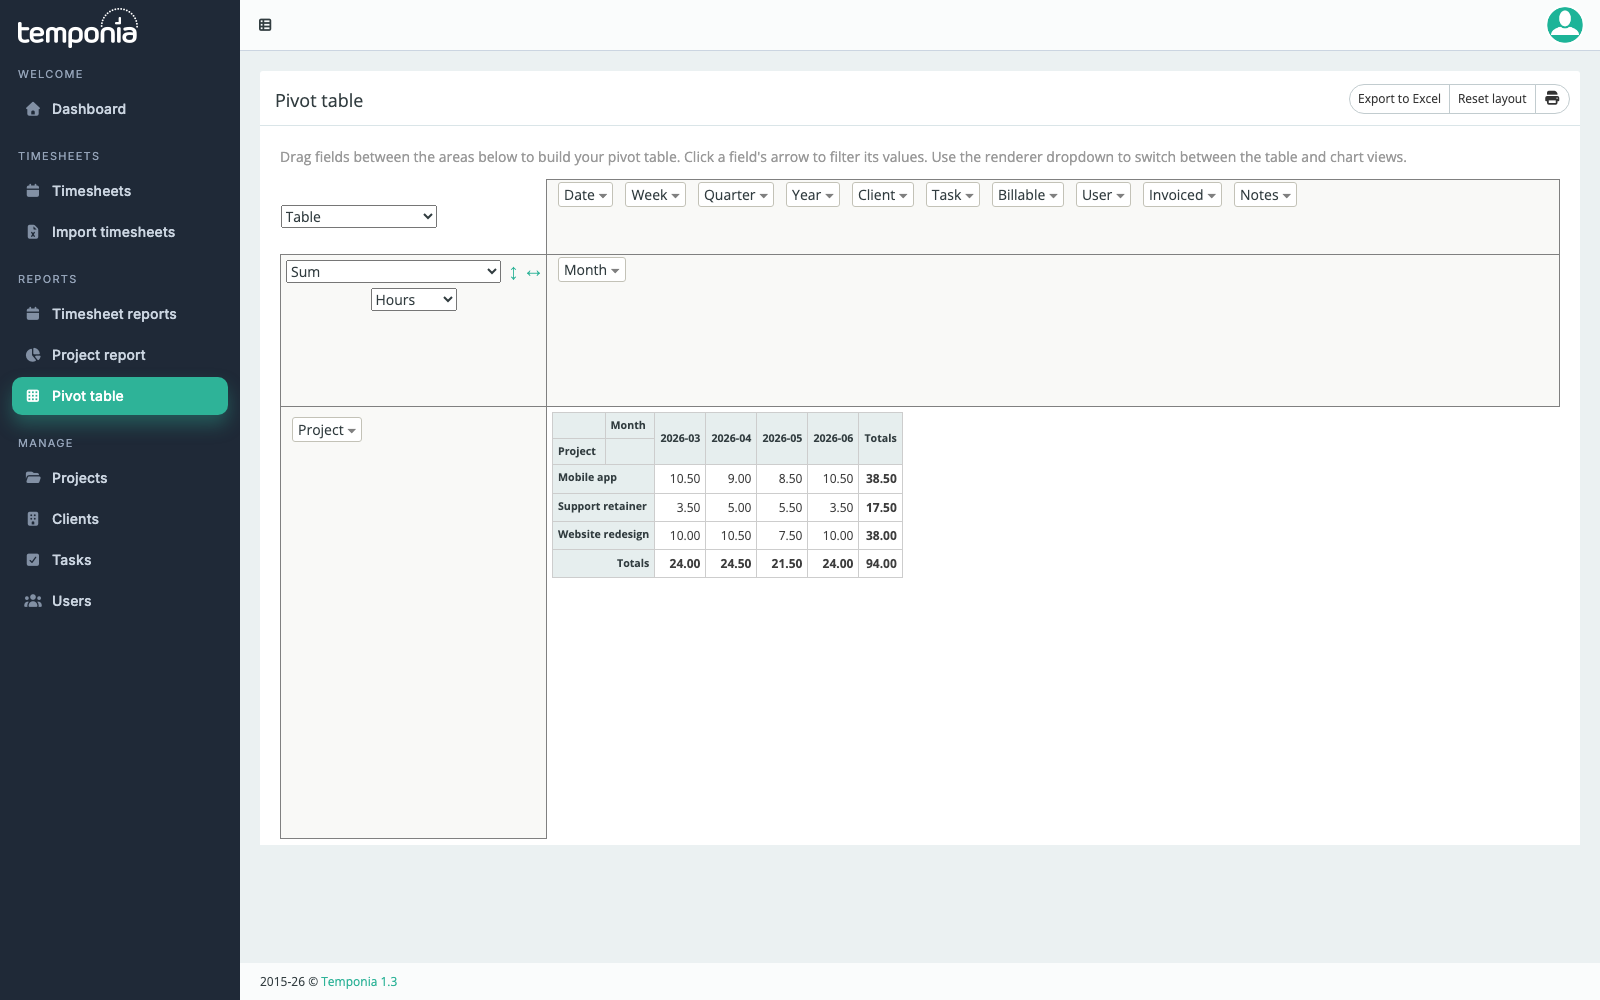
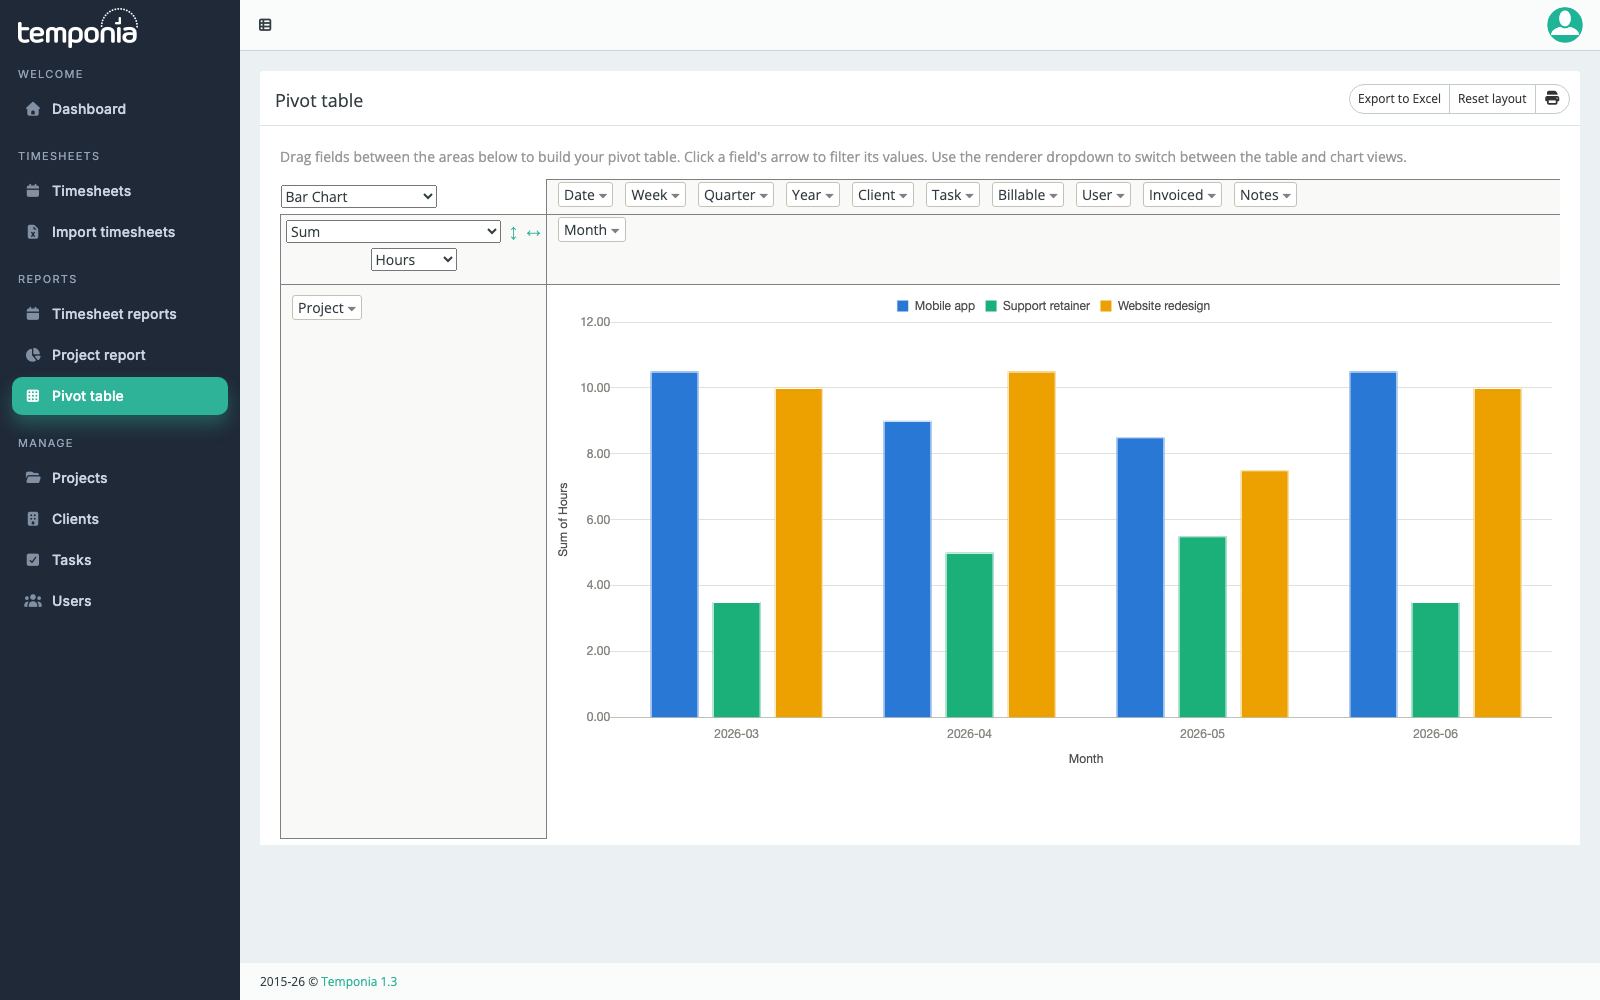
These Terms and Conditions ("Terms") govern access to and use of Temponia, a software-as-a-service time tracking and related platform (the "Service").
The Service is owned and operated by Entrysoft. Throughout these Terms, "Temponia" refers to the Service provided by Entrysoft.
Entrysoft legal details: Entrysoft, Warandestraat 98, 9140 Temse, Belgium, [email protected].
By creating an account, starting a trial, subscribing, or otherwise using the Service, you agree to these Terms.
1. Definitions
"Customer" means the individual or entity that registers for, purchases, or uses the Service.
"User" means any individual authorized by Customer to use the Service, including administrators.
"Account" means Customer's Temponia account and any associated workspaces, organizations, or teams.
"Plan" means a subscription tier (for example Free, Team, Enterprise) and related features, limits, and pricing made available by Temponia.
"Customer Content" means data and content submitted to the Service by or on behalf of Customer or Users (for example time entries, project names, invoices, files, and notes).
"Documentation" means Temponia documentation and help materials made available with the Service.
2. Eligibility and Authority
2.1 Business use. The Service is intended for business and professional use.
2.2 Authority. If you use the Service on behalf of an entity, you represent that you have authority to bind that entity, and "you" refers to that entity.
2.3 Age. Users must be at least 18 years old (or the age of majority where they live).
3. Account Registration and Administration
3.1 Account information. You must provide accurate and complete information and keep it updated.
3.2 Administrators. Customer may designate one or more administrators. Administrators can manage Users, permissions, billing, integrations, and settings, and may access and export Customer Content available within the Account.
3.3 Security. Customer is responsible for all activity under its Account, including User activity. Customer must use reasonable security measures (including strong passwords and enabling single sign-on where available).
3.4 Unauthorized use. Customer must promptly notify Temponia of any suspected unauthorized access to the Account.
4. License and Permitted Use
4.1 License. Subject to these Terms and timely payment of applicable fees, Temponia grants Customer a limited, non-exclusive, non-transferable, non-sublicensable right during the subscription term to access and use the Service and Documentation for Customer's internal business purposes.
4.2 Access methods. Customer must access the Service only through interfaces, clients, and APIs provided or expressly authorized by Temponia.
4.3 Ownership. Except for the limited rights expressly granted in these Terms, Temponia and its licensors retain all rights, title, and interest in and to the Service, Documentation, and all related intellectual property.
5. Plans, Trials, Subscriptions, and Billing
5.1 Plans and limits. Temponia offers multiple Plans with different features, limits, and prices. Plan details may be described on Temponia's pricing pages and in the checkout or order flow. If Plan details conflict between the pricing page and the order flow, the order flow controls for that purchase.
5.2 Trials. Temponia may offer free trials for certain Plans. Trials are provided as described at signup. Unless stated otherwise at signup, trials convert to a paid subscription when the trial ends if Customer does not cancel before the end of the trial.
5.3 Free Plan. Temponia may offer a free tier with limited features or usage. Temponia may change or discontinue the free tier at any time, subject to Section 12 (Changes).
5.4 Fees and billing cadence. Paid subscriptions are billed in advance on a monthly or annual basis, as selected at purchase. Fees are based on the Plan and any applicable usage basis (for example per User), as presented at checkout.
5.5 Auto-renewal. Unless Customer cancels before the end of the then-current subscription term, subscriptions automatically renew for an additional term of the same length (monthly renews monthly; annual renews annually) and Temponia will charge the applicable fees using Customer's payment method on file.
5.6 Cancellation. Customer may cancel renewal at any time through the account settings or as otherwise instructed by Temponia. Cancellation stops future renewals; access typically continues until the end of the then-current paid term unless otherwise stated in the Service.
5.7 Upgrades, downgrades, and seat changes. If Customer upgrades or changes Plans, pricing and effective date will be shown during the change flow. If Customer adds Users or otherwise increases billable usage, Temponia may charge the incremental fees in accordance with the in-product billing rules presented at the time of change.
5.8 Taxes. Fees are exclusive of taxes unless stated otherwise. Customer is responsible for any VAT, sales tax, or similar taxes, except for taxes on Temponia's income.
5.9 Payment failures. If a payment cannot be processed, Temponia may suspend access until payment is received. Temponia may also downgrade the Account to a free tier (if available) or terminate under Section 13.
5.10 Refunds. Except where required by mandatory law or expressly stated in an order form, fees are non-refundable and Temponia does not provide refunds or credits for partial periods, unused capacity, or downgrades.
5.11 Price changes. Temponia may change prices for future subscription terms by giving reasonable notice (for example via email or in-app notice). Price changes take effect at renewal unless stated otherwise.
6. Acceptable Use
Customer and Users must not, and must not attempt to:
- reverse engineer, decompile, disassemble, or otherwise attempt to derive source code or underlying ideas or algorithms of the Service (except to the extent prohibited by applicable law)
- access the Service to build, benchmark, or support a competing product or service, or for competitive analysis that is primarily intended to replicate the Service
- scrape, crawl, harvest, or use automated means to extract data from the Service except through authorized APIs and within documented rate limits
- interfere with or disrupt the Service, including by probing, scanning, or testing vulnerabilities without Temponia's prior written consent
- circumvent Plan limitations or access controls, including by creating multiple Accounts to avoid limits
- upload or transmit malware, or use the Service for unlawful, harmful, or abusive activities
- remove, obscure, or alter proprietary notices in the Service or Documentation
- use the Service in a way that violates applicable laws or regulations
Temponia may monitor for abuse and may suspend or terminate Accounts as described in Section 13.
7. Customer Content
7.1 Customer ownership. As between the parties, Customer retains ownership of Customer Content.
7.2 License to operate the Service. Customer grants Temponia a worldwide, non-exclusive license to host, store, transmit, reproduce, display, and process Customer Content solely to provide, maintain, and improve the Service and to provide support.
7.3 Customer responsibility. Customer is responsible for the legality, accuracy, and quality of Customer Content, for obtaining any necessary rights and permissions, and for configuring the Service appropriately for its intended use.
7.4 Feedback. If Customer provides feedback or suggestions, Temponia may use them without restriction or obligation.
8. Third-Party Services and Integrations
The Service may interoperate with third-party services (for example calendars, identity providers, accounting software). Temponia does not control third-party services and is not responsible for their availability, security, or terms. Use of third-party services is governed by the third party's terms.
9. Confidentiality
9.1 Confidential Information. "Confidential Information" means non-public information disclosed by one party to the other that is marked confidential or that a reasonable person would understand to be confidential given the nature of the information.
9.2 Obligations. The receiving party will protect the disclosing party's Confidential Information using reasonable care and will use it only to perform under these Terms.
9.3 Exclusions. Confidential Information does not include information that is publicly available through no fault of the receiving party, independently developed, rightfully received from a third party, or approved for release in writing.
9.4 Compelled disclosure. The receiving party may disclose Confidential Information if required by law, provided it gives notice when legally permitted.
10. Support and Service Changes
10.1 Support. Temponia provides support as described in the Service or Documentation and may change support channels or hours.
10.2 Changes to the Service. Temponia may modify, add, or remove features. Temponia will use reasonable efforts to provide notice of material changes that negatively impact core functionality of a paid Plan.
10.3 Beta features. Temponia may offer beta or early access features. These are provided "as is" and may be changed or discontinued at any time.
11. Term and Termination
11.1 Term. These Terms begin when Customer first accepts them and continue until the Account is terminated.
11.2 Termination by Customer. Customer may terminate by cancelling the subscription and discontinuing use. Termination becomes effective at the end of the current paid term unless Temponia agrees otherwise.
11.3 Termination or suspension by Temponia. Temponia may suspend or terminate access immediately if:
- Customer breaches Sections 4 or 6 (License and Acceptable Use)
- Customer fails to pay fees when due
- Customer's use poses a security risk, may harm the Service, or may expose Temponia or others to liability
- Temponia is required to do so by law
Where reasonably practicable, Temponia will provide notice and an opportunity to cure.
11.4 Effect of termination.
- Customer's rights to use the Service stop at termination.
- Upon request made within 30 days after termination, Temponia will make commercially reasonable efforts to allow Customer to export Customer Content using standard export features, unless prohibited by law or technically infeasible.
- After termination, Temponia may delete Customer Content in accordance with its standard retention practices, except where Temponia is legally required to retain it.
11.5 Survival. Sections that by their nature should survive termination survive, including Sections 4.3, 6, 7.1, 9, 12, 14, 15, and 16.
12. Disclaimer of Warranties
THE SERVICE AND DOCUMENTATION ARE PROVIDED "AS IS" AND "AS AVAILABLE." TEMPONIA DISCLAIMS ALL WARRANTIES, EXPRESS OR IMPLIED, INCLUDING IMPLIED WARRANTIES OF MERCHANTABILITY, FITNESS FOR A PARTICULAR PURPOSE, TITLE, AND NON-INFRINGEMENT.
TEMPONIA DOES NOT WARRANT THAT THE SERVICE WILL BE UNINTERRUPTED, ERROR-FREE, OR FREE OF HARMFUL COMPONENTS.
13. Limitation of Liability
13.1 Exclusion of damages. TO THE MAXIMUM EXTENT PERMITTED BY LAW, TEMPONIA WILL NOT BE LIABLE FOR ANY INDIRECT, INCIDENTAL, SPECIAL, CONSEQUENTIAL, OR PUNITIVE DAMAGES, OR FOR LOSS OF PROFITS, REVENUE, GOODWILL, OR DATA, EVEN IF ADVISED OF THE POSSIBILITY.
13.2 Liability cap. TO THE MAXIMUM EXTENT PERMITTED BY LAW, TEMPONIA'S TOTAL LIABILITY ARISING OUT OF OR RELATED TO THESE TERMS WILL NOT EXCEED THE AMOUNTS PAID (AND PAYABLE) BY CUSTOMER TO TEMPONIA FOR THE SERVICE IN THE 12 MONTHS BEFORE THE EVENT GIVING RISE TO THE CLAIM.
13.3 Exceptions. Nothing in these Terms excludes liability that cannot be excluded under applicable law.
14. Indemnification
Customer will indemnify and hold harmless Temponia and its affiliates, officers, directors, employees, and agents from and against any third-party claims, damages, and expenses (including reasonable attorney fees) arising from:
- Customer Content
- Customer or User use of the Service in violation of these Terms
- Customer or User violation of applicable law
Temponia will promptly notify Customer of any claim and reasonably cooperate (at Customer's expense). Customer will control the defense and settlement, provided it does not admit fault or impose obligations on Temponia without Temponia's prior written consent.
15. Force Majeure
Neither party is liable for delay or failure to perform due to events beyond its reasonable control (for example natural disasters, war, labor disputes, internet or cloud provider failures), provided it uses reasonable efforts to mitigate.
16. Governing Law and Disputes
These Terms are governed by the laws of Belgium, excluding conflict of law rules.
The courts of the judicial district where Entrysoft has its registered office have exclusive jurisdiction, unless mandatory law provides otherwise.
17. Miscellaneous
17.1 Assignment. Customer may not assign these Terms without Temponia's prior written consent, except to an affiliate or in connection with a merger, acquisition, or sale of substantially all assets, provided the assignee agrees in writing to be bound. Temponia may assign these Terms in connection with a corporate reorganization, merger, acquisition, or sale of assets.
17.2 Subcontractors. Temponia may use subcontractors to provide parts of the Service.
17.3 Notices. Temponia may provide notices via email, in-app notice, or by posting in the Service. Customer notices to Temponia must be sent to [email protected] and are deemed given when received.
17.4 Entire agreement. These Terms are the entire agreement between the parties regarding the Service and supersede prior or contemporaneous agreements on the subject.
17.5 Severability. If any provision is held unenforceable, the remaining provisions remain in effect.
17.6 Waiver. Failure to enforce a provision is not a waiver.
17.7 Order of precedence. If Customer signs an order form or written agreement with Temponia that conflicts with these Terms, that order form or written agreement controls to the extent of the conflict.